When working with maps, several formatting options are afforded that enable you to design the map according your needs. For instance, you can select the specific map type, customize the map colors, add zoom control buttons, and more.
Map Formatting options
There are four map types, each of which can be formatted as needed:
- Bubble Map: Bubble maps are used to display data geographically, with bubbles used to represent values: the larger the bubble, the larger the value.
- Shape Map: Shape maps are used to create a map displaying polygon shapes.
- Geo Heat Map: Geo heat maps are used to represent the map's measure as a range of colors.
- Layered Map: Layered maps are a combination of a Bubble and Shape maps, with data points displayed as bubbles and map data in polygons.
Additional Formatting options
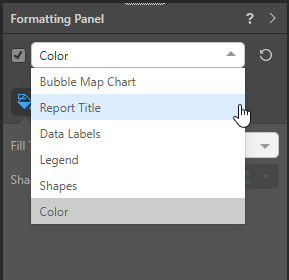
The following additional formatting views (see below) are also available for each of the maps:
- Report Title: Customize the report title.
- Data Labels: (Bubble and Shape maps only.) Show, hide, or adjust the data labels shown on shape maps.
- Legend: Edit the report legend by changing its position, layout, and fonts.
- Shapes: (Layered, Bubble, and Geo Heat maps only.) Customize the appearance of "shapes" used on maps.
- Color: Customize the colors used.